In 2022, public expenditure per capita amounted to almost 36,000 PLN, and per one working person – 79,381 PLN. All public spending is financed either by taxes we pay or by government-issued debt (which means higher taxes in the future). Many people, demanding the implementation of further social programs by the state, do not realize that it is associated with higher taxation of the people (now or in the future).
As Margaret Thatcher observed: “If the state wishes to spend more, it can do so only by borrowing your savings or by taxing you more. There is no such thing as public money, only taxpayers’ money.”
For the twelfth time, the Civil Development Forum has prepared the “Bill from the state”, which shows the spending of the Polish state broken down into the most important categories and divided per capita. The “Bill from the state” includes all public expenditure, not only those recorded in the so-called state budget, which constitute only a part of the entire general government sector.
Growing Fiscal Opacity
Especially in recent years, the state budget has been losing its position as the most important financial plan of the state. On June 7, The Council of the Supreme Audit Office (NIK) for the first time in the history of the Third Republic of Poland did not grant a positive opinion on the government’s budget management, which is the result of pushing a large part of expenses that should be implemented as part of the state budget to off-budgetary funds at Bank Gospodarstwa Krajowego. By spending funds through BGK funds and using other tricks, the government is able to show any result in the state budget, which is regularly pointed out by the Supreme Audit Office in its audits.
Expenditures in BGK funds do not increase the state deficit, and the debt incurred by BGK, although it is used to finance public tasks and is guaranteed by the State Treasury, does not increase the “state public debt” for which constitutional limits apply.
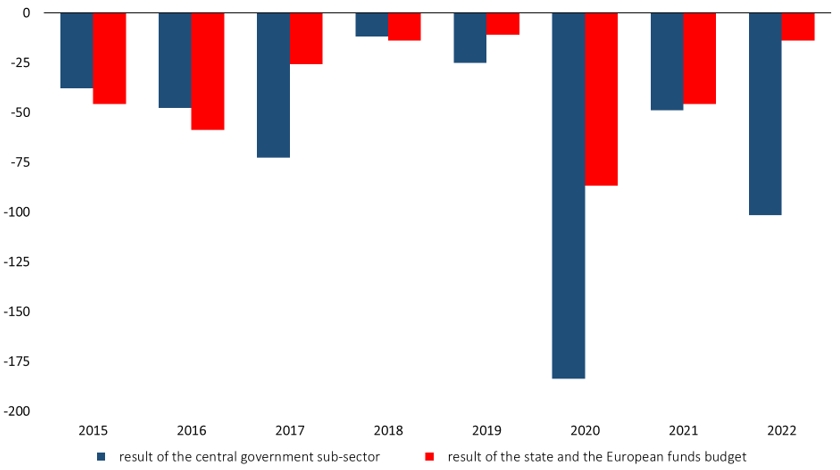
In its opinion on government’s budget management, the Council of NIK alarms that in 2022
“the deficit of the state budget and the budget of European funds in total accounted for only 12.1% of the deficit of sub-sector of the government institutions. […] This means that the operations of this sub-sector were outside the state budget. Operations resulting in a deficit of more than six times the total deficit of the state budget and the budget of European funds.”
In addition, the NIK Council indicates that:
“for three years, on an unprecedented scale, activities have been carried out which violate the basic budget principles, in particular transparency, unity, clarity and annuality of the budget. […] These activities not only affect the transparency of the presented data on public finances, but also prevent their comparison in subsequent years, and most importantly, they hinder parliamentary and social control over the collection and spending of public funds.”[1]
Chart 1. The result of the central government sub-sector and the state and the European funds budget
Increase in Public Spending
The Civil Development Forum in the “Bill from the state” includes all public expenses, including those made outside the state budget by funds in BGK. In 2022, public expenditure amounted to 1.34 trillion PLN. It accounted for 43.5% of GDP – less than in 2020-2021 but still more than before the outbreak of the pandemic (41.9% of GDP in 2019). Since 2015, public spending in Poland has increased by over 78% in nominal terms and by 38% in real terms.
Chart 2. The bill from the state in 2015–2022
Three sources of financing the increase in public spending can be identified:
- Thanks to the good economic situation in Western Europe and the influx of workers from Ukraine, the Polish economy was growing relatively quickly despite the incorrect economic policy of the government.
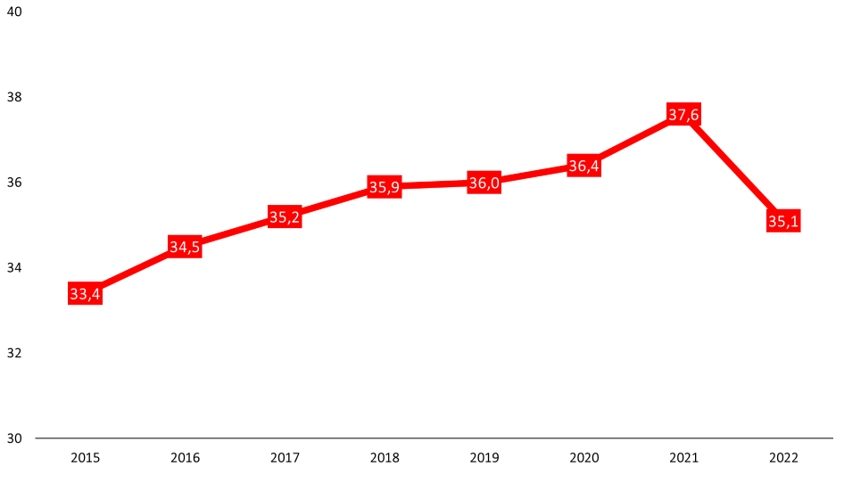
- The PiS government introduced many new taxes, often called fees or duties (“emission fee”, “solidarity duty”, and in addition, for example the bank tax and trade tax). In 2015–2022, the tax and contributions burden increased by 1.7% of GDP. As a result, Poland ranks third among the countries of the region in terms of the size of the tax and contributions burden (after Croatia and Slovenia).
- Public sector debt increased. Despite the very good economic situation, the government failed to balance public finances. As a consequence, public debt, calculated according to the EU methodology, increased in 2015–2022 by 64% (nearly 16,000 PLN per capita).
Chart 3. Tax and contributions burden as % of GDP
The Structure of Public Spending in Poland
The largest category of public expenditure was, as every year, retirement and disability pensions. The average resident of Poland spent 9,731 PLN on them, including “thirteen” and “fourteen” pensions. This is much more than the total for health care (4,195 PLN) and education and science (3,556 PLN).
For years, FOR has been recommending to reduce retirement expenses by raising the retirement age, abolishing the privilege of early retirement (with possible adjustment of the amount of contributions in the case of professions, e.g. miners, in the case of which a lower retirement age may have some justification), the inclusion of farmers, soldiers, police officers, judges and prosecutors in the general pension system, as well as stopping further “gifts” paid with taxpayers’ money, such as “thirteen” and “fourteen” pensions.
All these factors weaken the development potential of the Polish economy. Unfortunately, politicians are very eager to promise pensioners more payments, while avoiding reforms of the system. It should be emphasized that Poland spends more on pensions than other countries of Central and Eastern Europe at a similar level of development, and at the same time it is a society that is aging very quickly.
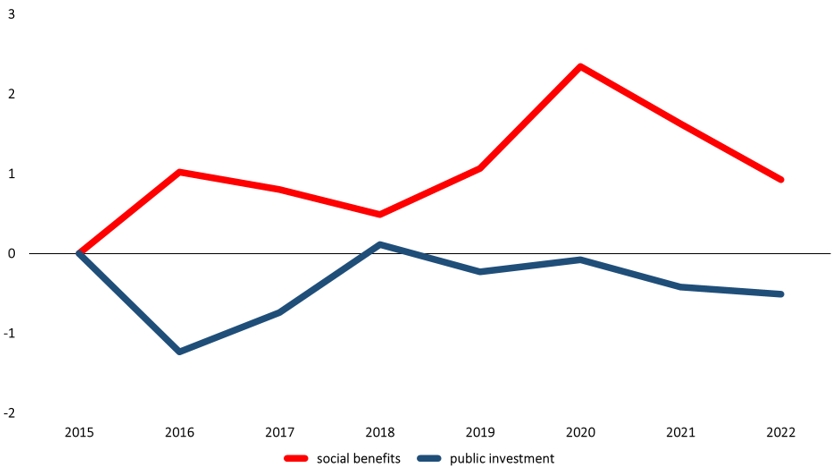
In 2015-2022, social spending in real terms increased in Poland by almost 41% – it was the fourth highest result in the EU. Social expenditure grew faster than the economy – it increased by 0.9 p.p. in relation to GDP.
On the other hand, the significance of public investment decreased – as compared to GDP it decreased by 0.5 p.p. The decline in social spending in relation to GDP in the last two years resulted from high inflation, but before the upcoming parliamentary elections, Law and Justice’s politicians announced an expansion of the “500+”. This means that next year we can expect an increase in social spending in relation to GDP.
Chart 4. Change in government spending as % of GDP
Growing Interest on Public Debt
For a long time, the interest on public debt decreased – as a result, despite the growing public debt, the cost of servicing it remained more or less constant. The increase in interest rates from the second half of 2021 meant that interest on Polish public debt began to grow rapidly.
In 2022, interest per capita is higher by 665 PLN (by 86%) than the year before. It will continue to grow this and next year. As a consequence, in 2024 the cost of public debt servicing will exceed 2,000 PLN. For comparison, the cost of the “500+” program is approx. 1,100 PLN per capita. Only Hungary will pay interest higher than Poland in relation to the size of the public debt this and next year.
Chart 5. Cost of public debt servicing per capita

Source: FOR’s own study based on successive editions of the “Bill from the state” and forecasts of the European Commission
Projections for Polish Public Finances
Contrary to government propaganda, Polish public finances are in bad condition. This was admitted by the Ministry of Finance, which in March this year in its opinion on the draft act introducing preferential housing loans, stated:
“Unfortunately, in the coming years there is no space for new expenses incurred from the state budget. Thus, in order to increase spending on new tasks, it is necessary to find a source of financing them by limiting other expenses.”
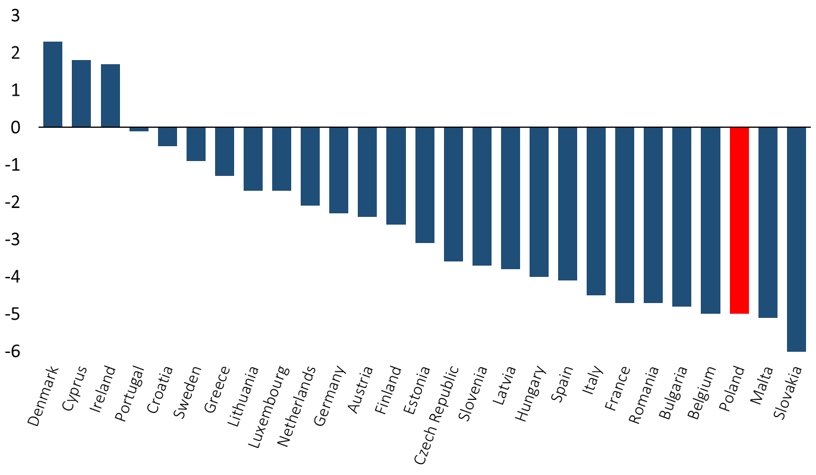
The European Commission’s forecasts for this and next year indicate a high deficit of the general government sector in Poland. This year, the deficit is expected to amount to 5% of GDP – the third-worst result in the European Union. The International Monetary Fund forecasts that the general government deficit will exceed 3% of GDP by 2028.
Despite this, politicians, before the upcoming elections, make further promises of spending public money without indicating the sources of financing. Thus, Poland’s deficit may in the future be higher than currently forecasted. This scenario means a further increase in public debt and, consequently, a further increase in the cost of servicing it.
Chart 6. Projected result of general government sector as % of GDP in European Union countries in 2023
State’s expenditures are not only the expenditures of the central budget, but also of local authorities, the National Health Fund, the Social Insurance Fund managed by ZUS, KRUS and many other entities, including funds in Bank Gospodarstwa Krajowego, importance of which has been growing in recent years.
Although the vast majority of public expenditure falls on a few institutions, it should be remembered that the entire public finance sector covers over 61,000 different units. It includes schools, universities, hospitals, as well as entities such as the management of municipal cemeteries, city parks or film studios “TOR”, “ZEBRA”, “KADR”. Due to the inability to obtain data for all 61,000 entities and correcting the flows between them, and the fact that some of the data we use is estimated, “Bill from the state” includes the balancing item “Other”.
“Bill from the state” presents state expenditures per capita in Poland. Although this is a simplified approach, we chose it because it shows state spending in amounts understandable to an ordinary citizen. Of course, the amount of taxes and contributions paid by a particular person depends on how much he or she earns and what he or she buys. On the SprawdzPodatki.pl site prepared by FOR, everyone can check how much of a given salary must be given to the state in taxes and contributions. Additionally, by indicating the purchases made by specific person, everyone can receive their own, individualized bill from the state.
[1] Resolution of the Council of the Supreme Audit Office of 7 June 2023 on the opinion on the budget management for the Council of Ministers for 2022 ,p.2, https://orka.sejm.gov.pl/Druki9ka.nsf/0/601C13FC7C60B00DC12589CF00369630/%24File/3371-001.pdf.
Written by Marcin Zieliński & Bartłomiej Jabrzyk


