
In 2016, exports of goods from Ukraine to the EU increased by 3.7% compared to 2015 year on year (yoy), amounting to USD 13.5 bn in value. Exports to the EU performed much better than total exports. As total exports decreased by 4.6% yoy, the share of the EU continued to grow and reached 37%, which means that the EU is the leading foreign consumer of the Ukrainian goods. At the same time, the value of exports to the EU remained lower than before the crisis. In 2016, nominal exports to the EU reached only 80.5% of value in 2013.
What exactly does Ukraine sell to the EU? Has the trade structure changed during last three years taking into account multiple factors such as improved access to the EU market, lower global commodity prices, and economic crisis of 2014-2015?
Surprisingly, despite a number of economic shocks, the commodity bundle of exports to the EU changed very little as compared with 2013. Both in 2013 and in 2016, corn, sunflower oil, ignition wiring sets (insulated electric conductors), iron ore, and metal products were in the first positions on the list of products exported to the EU.
Table 1: Commodity structure of exports to the EU: unchanged “top-8”
|
2013 |
2016 |
|
|
Crude sunflower oil |
2% |
8% |
|
Corn |
10% |
8% |
|
Ignition wiring sets |
6% |
7% |
|
Semi-finished products of iron and non-alloy steel, containing by weight <0.25% of carbon |
10% |
5% |
|
Iron ores and concentrates, agglomerated |
4% |
4% |
|
Iron ores and concentrates, non-agglomerated |
6% |
3% |
|
Oil-cake and other solid residues from sunflower seeds |
3% |
3% |
|
Low erucic acid rape seeds |
5% |
3% |
|
Other |
54% |
60% |
Source: Own calculations, Ukrstat, UN ComTrade, HS classification
However, their sequence on the list changed. Sunflower oil took first place, increasing its share of the total from 2% in 2013 to 8% in 2016, with exports growing in value by 160% to USD 1.04 bn. Corn shifted to the second place (8% share of exports and USD 1.02 bn), mostly due to re-orientation of sales to Asian markets. Ignition wiring sets, the share of which in exports to the EU increased from 6% to 7% and nominal value grew by 6% to USA 1.01 bn, were in the third place.
The level of concentration of exports slightly decreased. In 2013, the first ten goods (identified at the 6-digit HS level) accounted for 50% of exports to the EU, compared to 44% in 2016.
However, diversification occurred not due to the emergence of new products never before exported to the EU, but due to changes in exports of “traditional”, i.e. regularly exported to the EU in 2013-2016, products. The share of such products was 99%. Goods not exported in 2013-2015 but supplied to the EU market in 2016 constituted only about 0.1% of exports.
One of the most important changes in exports structure occurred in 2013-2016 was a decline in shares of raw materials and semi-finished products in exports to the EU and, correspondingly, the increase in the share of processed products, which reached 44% of all sales in 2016 (Figure 1).
Figure 1: The Structure of Exports to the EU by the Level of Products Processing
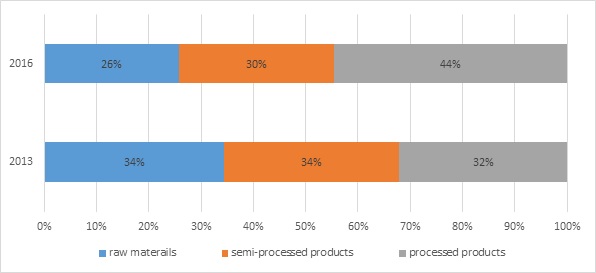 Source: Own calculations, Ukrstat, UN ComTrade, classification MTN
The shift is attributable to the increase in food exports by 52% during 2013-2016, accounting for one-third of all exports of processed goods to the EU (in 2013 this share was 24%).
Apart from the already mentioned growth in sunflower oil exports, there was a noteworthy increase of supplies of animal-origin products, in particular, dairy products. The access of animal-origin products to the EU market was the result of reform both in public policy regarding food safety and of enterprises seeking to access the EU market. During 2013-2016, the number of animal-origin products permitted to export to the EU and the verified companies has increased by several times.
There were changes also in the structure of exports by broad economic categories. In 2016 compared to 2013, the share of consumption goods increased from 9% to 13%, while the share of intermediate goods declined to 84%. Supplies of capital goods to the EU remained at the 2% level.
Figure 2: The Structure of Exports to the EU by Broad Economic Categories
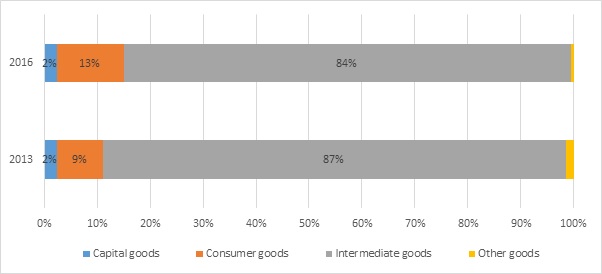 Source: Own calculations, Ukrstat, UN ComTrade, classification BEC/SNA
Since the share of intermediate goods in exports to the EU is higher than in total exports (84% vs. 77%), this may mean an increasing level of Ukraine’s integration into the EU value chains compared to other countries’ chains.
Among consumption goods, the share of durable goods slightly increased due to exports of electrical appliances, and the share of semi-durable goods grew thanks to higher exports of light industry products and furniture. In addition, exports of processed food products for human consumption, in particular, meat products, increased.
Table 2: Exports structure to the EU by broad economic categories
-
2013
2016
Capital goods
2%
2%
Сapital goods (except transport equipment)
2%
2%
Transport equipment, industrial
1%
0%
Other categories of goods
1%
1%
Motor spirit
1%
0%
Passenger motor cars
0%
0%
Consumer goods
9%
13%
Food and beverages, primary
1%
1%
Food and beverages, processed
2%
3%
Transport equipment, non-industrial
0%
0%
Durable consumer goods
1%
2%
Non-durable consumer goods
1%
1%
Semi-durable consumer goods
4%
5%
Intermediate goods
87%
84%
Food and beverages, primary
8%
6%
Food and beverages, processed
1%
1%
Industrial supplies, primary
23%
17%
Industrial supplies, processed
48%
54%
Fuels and lubricants, primary
2%
1%
Fuels and lubricants, processed
2%
2%
Parts and accessories of capital goods (except transport equipment)
3%
3%
Parts and accessories of transport equipment
1%
1%
Source: Own calculations, Ukrstat, UN ComTrade, classification BEC/SNA.
Summing up, despite the growth in exports to the EU and the increase in its share in total exports of goods, it is too early to talk of significant changes in export structure. Still, the growth of the processed products exports means that Ukraine expands exports of products with higher value added.
Research and policy advice project supported by the Swedish International Development Cooperation Agency (Sida).
Available for free download at http://www.3dcftas.eu/

