The year 2018 was a distinct year for Ukraine’s goods exports featuring several “never-before” statistical facts.
On the one hand, the value and share of exports to the European Union reached their historic maximum, backed by the stimuluses provided by the DCFTA.
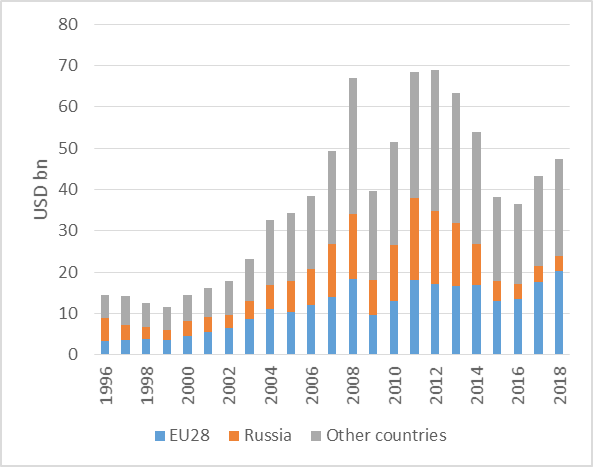
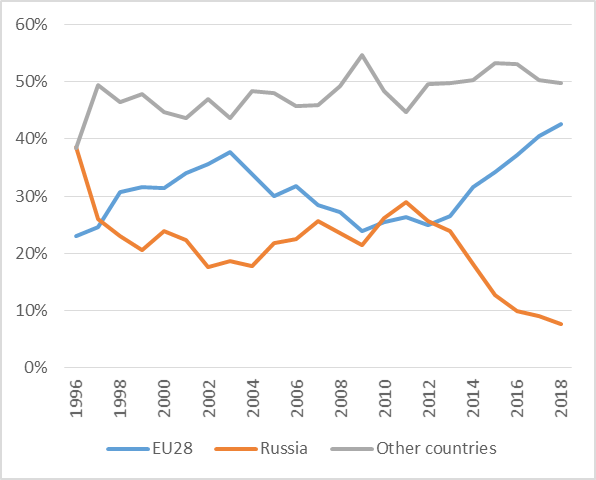
According to the Ukrstat, Ukraine exported USD 20.2 bn to the EU, surpassing the previous peak registered in 2008, i.e. before the hardships of two economic crises and the occupation of the part of Ukraine’s territory. The share of the EU in total exports reached 43%, adding 1 percentage point compared to the previous year peak.
Ukraine’s exports to the EU have continued to grow much faster than exports to the rest of the world. While exports to the EU increased by 15% year-on-year in 2018, the growth of exports to the rest of the world was at much less impressive 6%.
On the other hand, exports of goods to Russia resumed their decline after a short-lived rebound observed in 2017. In 2018, the value of shipments to Russia dropped by 7% to USD 3.7 bn. The share of Russia dropped to 8%, the historic minimum in relations with this country.
Thus, so far the post-DCFTA increase in the importance of the EU in the structure of Ukraine’s goods exports has been mirrored by the reduction in the importance of Russia, while the role of other trade partners – especially the Asian countries – has remained fairly stable.
Ukraine’s exports in goods, % of total, 1996-2018
At the same time, in 2018 Ukraine’s total exports grew only half as fast as in the year before – a moderate 9% compared to 19% in 2017. The growth of exports to the EU also decelerated to half the 30% expansion in the previous year.
The key factor driving the deceleration of exports was the development of domestic production, primarily of agro-food products. Agricultural and food products occupy about a third of total goods exports, so the volatility in domestic harvests almost inevitably affects exports.
In 2017, Ukraine harvested less grains, sunflower seeds, and soya beans, negatively influencing export performance in the marketing year 2017/2018.
For example, the sunflower seed harvest dropped by 10% in 2017, leading to the 8% decline in the domestic production of sunflower oil in 2018, and undermining exports. Similarly, the reduction in soya beans and barley harvest in 2017 translated into lower exports in 2018.
The fluctuations of global prices was another factor affecting 2018’s exports, although the impact differed depending on products. Wheat exporters were lucky, compensating lower volumes of exports by high prices, so the value of exports continued to expand.
However, producers of fero-silico-manganese suffered from adverse price trends and saw a 7% drop in exports after their impressive 73% expansion a year before.
Noteworthy, the changes in total exports by product were not distributed equally among partners. In the case of the sunflower oil, exports to the EU dropped by almost 26%, while exports to other destinations, in particular India, increased. On the other hand, exports of wheat to the EU grew faster than to other destinations.
The reduction in exports to Russia, unlike to other destinations, was not driven only by economic factors. About the third of the drop in exports is attributed to turbo-propellers and associated spare parts, which are dual-purpose (civilian and military) goods, exports of which have been stopped.
What to expect in 2019? The 2018 harvest was good so the domestic preconditions affecting exports improved. Exports to Russia will definitely continue to decline given new sanctions set by Russia in last days of December 2018. Exports to the EU are expected to continue growing, although the initial DCFTA stimulus provided by tariff liberalizations have begun to fade.
However, a new set of stimulus is to be provided by the reduction in trade costs associated with customs and product safety requirements. The results of Ukraine’s presidential and parliamentary elections will determine how fast this new stimulus may be delivered.
The article was published as 3 DCFTAs Op-ed No 4/2019, March 2019 on http://3dcftas.eu
The article was prepared within the framework of the core support programme to CEPS-led 3DCFTAs project, enabled by the financial support from Sweden.
Views, conclusions or recommendations belong to the authors and compilers of this publication and do not necessarily reflect the official position of the Government of Sweden. The responsibility over the content lies solely with authors and compilers of this publication.


